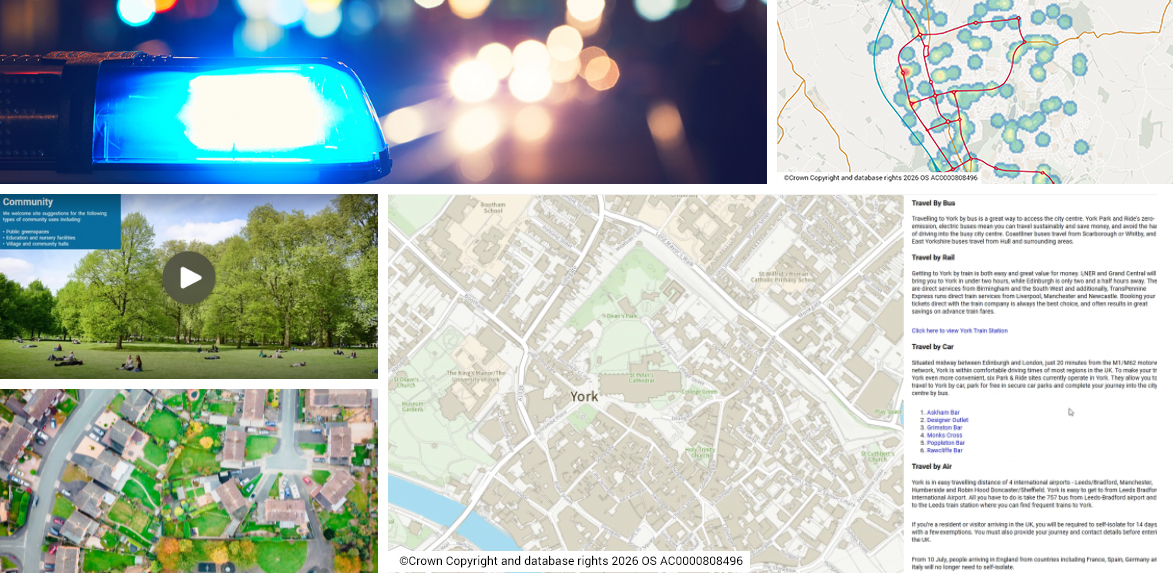
For organisations wishing to share map-based information with a community of users
SIS WebMap is a sophisticated yet easy-to-use web mapping application. It provides advanced capabilities for presenting and interrogating spatial data, accessed through a familiar and responsive interface.
It has been designed to run on mobile devices, tablets and PCs.
Contact Us Today
Web mapping software on all platforms

Web mapping software on all platforms
SIS WebMap features a responsive interface that adjusts the layout and functionality to the device.
On smaller screens, the application uses a simplified interface. This features finger-tap data interrogation and navigation, a Quick Search facility, and geolocation detection.
Advanced capabilities for presenting and interrogating spatial data
SIS WebMap has been designed as an easy-to-use, dynamic web mapping application with a familiar look and feel while providing the ability to run complex spatial queries.
Functionality includes map window controls, map navigation, printing, Quick Search, drawing, mobile geolocation, spatial query, and optional editing.

Search and query GIS data

Search and query GIS data
Web mapping can include a number of map layers or overlays. Some map layers can be the organisation’s own business data, while other layers can be from outside the organisation, such as maps produced by a national mapping agency.
Where attribute data exists, a map layer can be considered as ‘intelligent’ and can be queried. SIS WebMap reads open data sources such as OGC WMS, WMTS, WFS, and tile cache services, together with databases and proprietary data formats managed in a SIS project.
SIS WebMap can directly consume and present spatial data in over 300 supported GIS, CAD, graphic and database formats without translation.
SIS WebMap add-ins
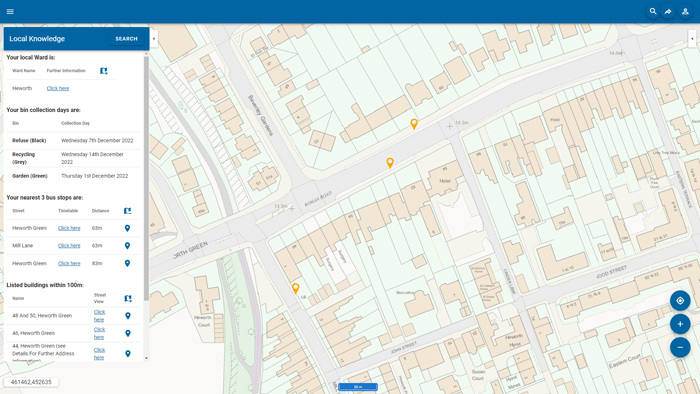
Returns answers to questions about a locality, such as:
- What is near?
- How many are near?
- How far are they?
Results can be returned in tabular form, and users have the ability to ‘drill down’ to reveal more detailed information about individual items returned.
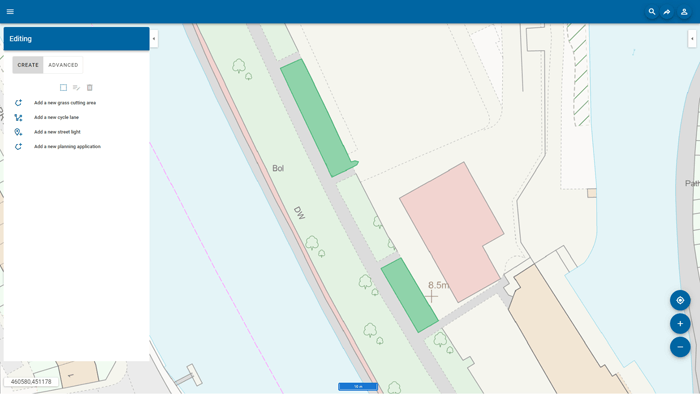
Allows online editing and creation of features and their attributes, stored in a spatial database. Overlay properties can be applied to update changes and additions to the data dynamically.
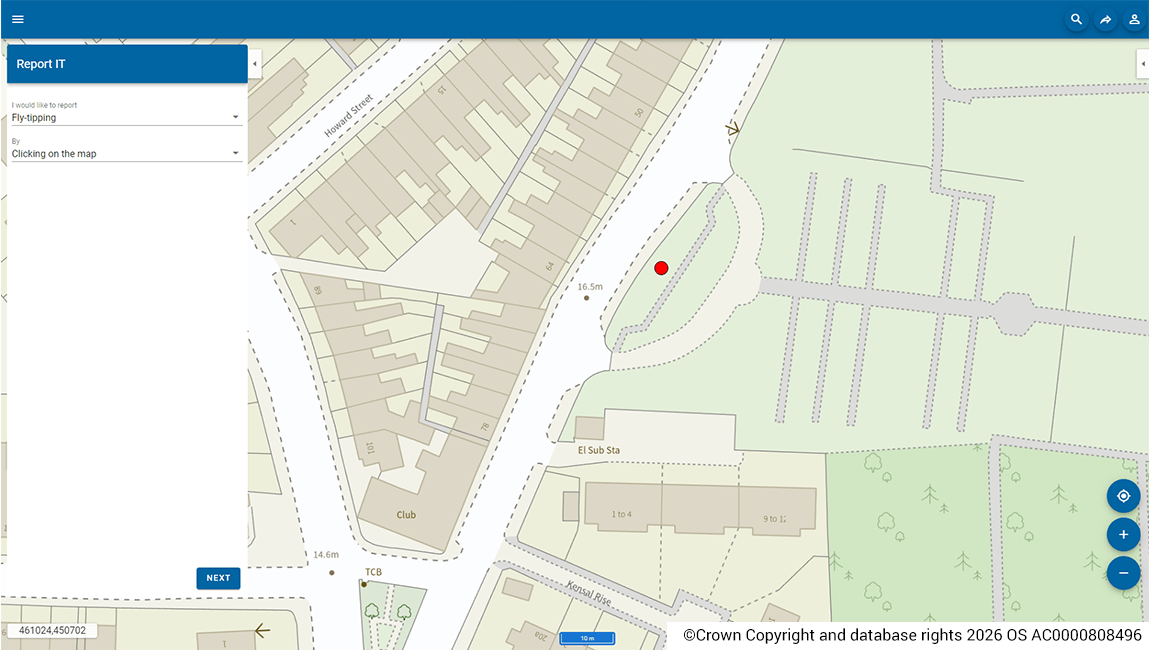
Report and locate incidents on a map using the mobile or desktop interface. Select an incident type to report, add a description, include contact details, place a marker on the map, and from a mobile interface, use the current location.
See how in our online demonstrator >>
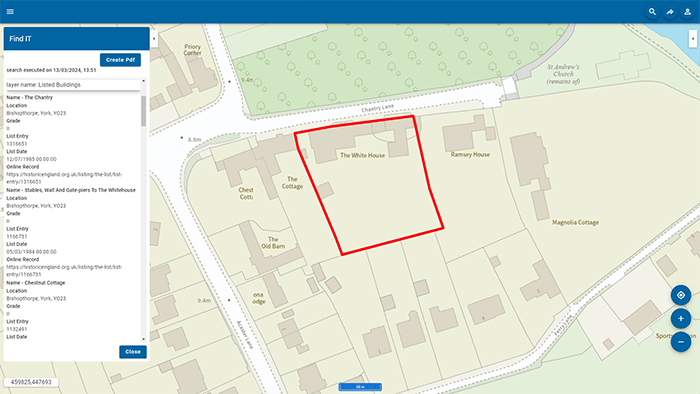
Query a large number of data layers (typically planning constraints), by a user-defined area. Results are recorded in a database and are available for viewing on-screen and to download as a PDF.
RELATED PRODUCTS AND SERVICES
Latest Insights