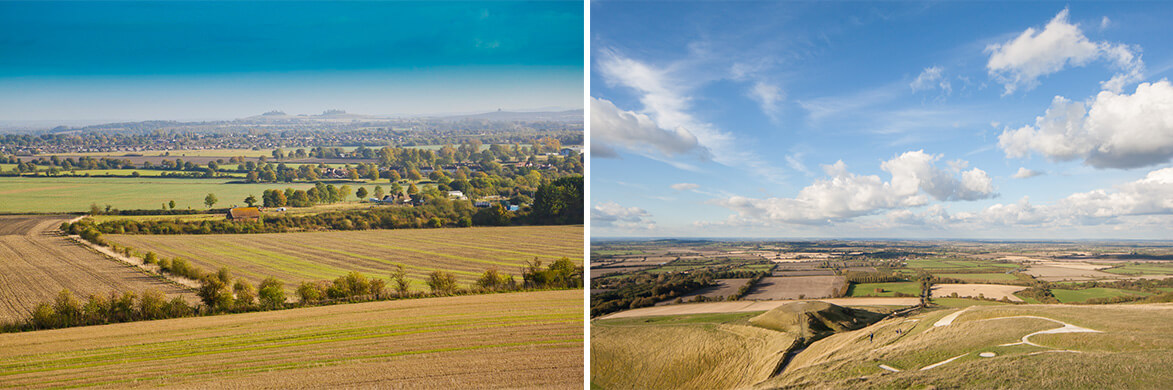
For the creation and preparation of geographic information
SIS Desktop is able to provide the creation and management of geographical information, advanced spatial analysis, support for Ordnance Survey® data, 3D analysis and connections to over 300 different formats of spatial data, including common spatial databases such as PostGIS, Oracle and Microsoft SQL Server, all out of the box
Contact Us Today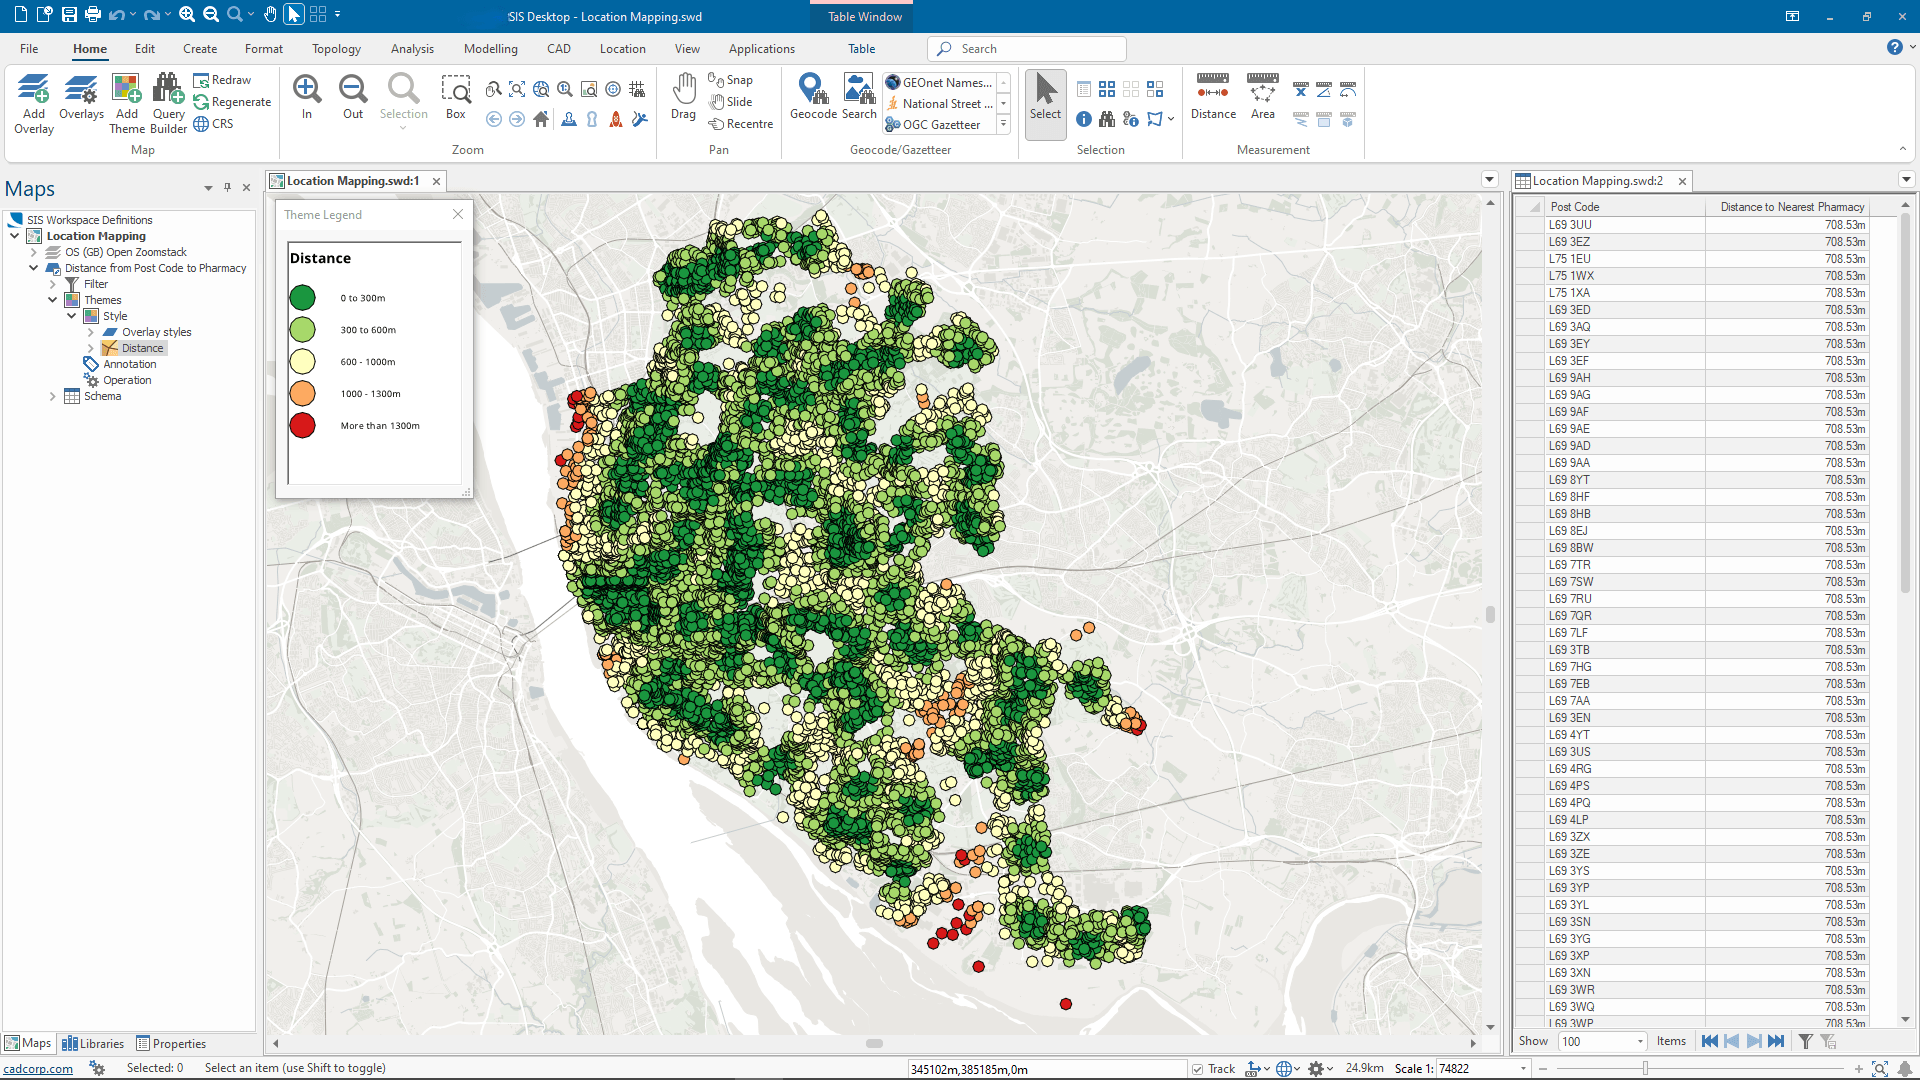
Familiar and intuitive user experience
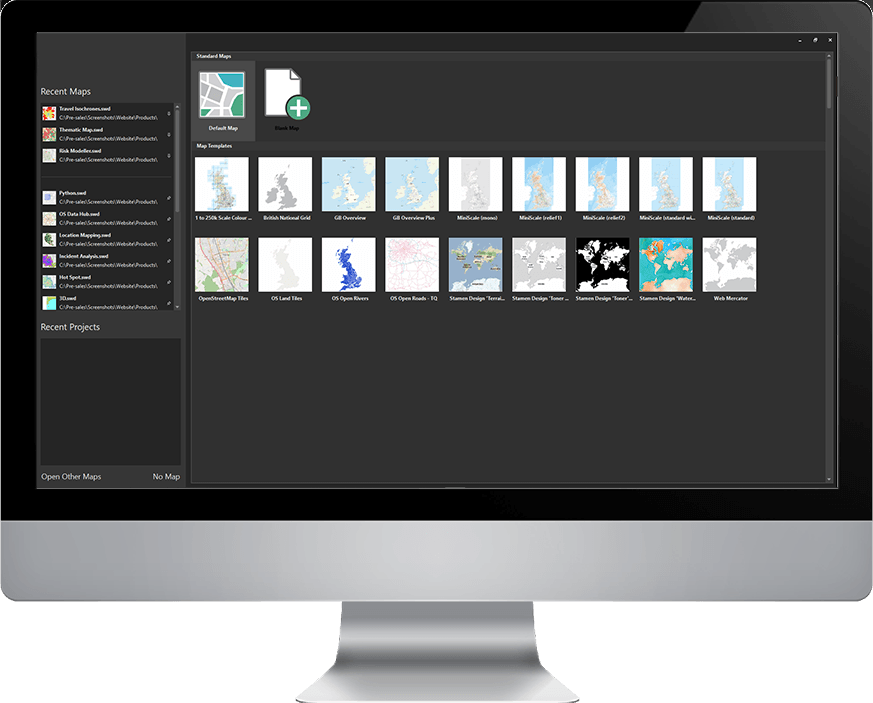
Familiar and intuitive user experience
Working with SIS Desktop is a very similar user experience to that of using various Microsoft Office products. It offers a “Backstage View,” a “Recent Maps” list, and the ability to pin frequently used maps and projects.
SIS Desktop supports drag and drop for adding basemapping, overlays and project files.
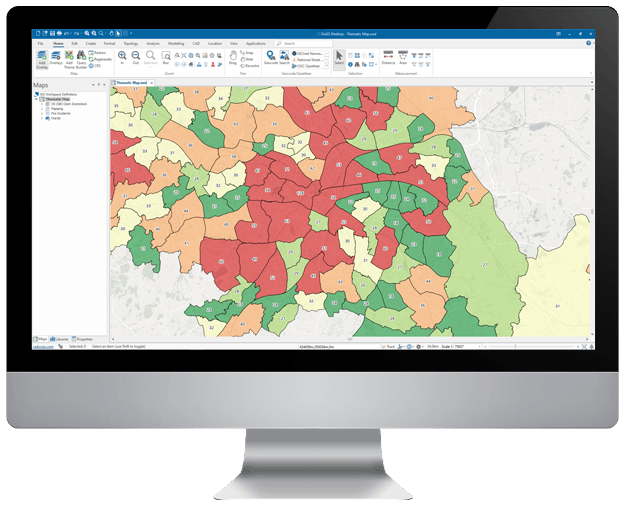
Comprehensive mapping and styling tools
Map data can be rapidly assembled and managed using a wide variety of built-in map management tools.
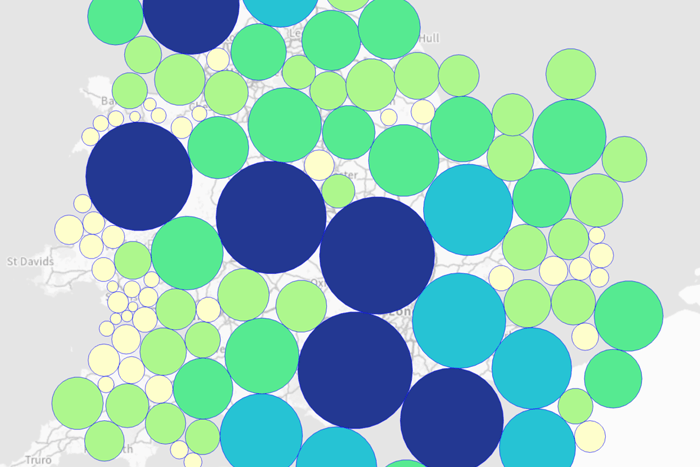
Create new map items such as points, line strings, and polygons, and determine their graphic representation. Design cartographic output in the form of thematic maps, in which map items are styled or labelled according to their properties or attribute values.
A user-friendly, intuitive, and interactive Print Wizard guides users through standard printing steps, using a wide range of predefined or custom print templates. Interactive Adobe PDF files can be published that allow end-user control over layer visibility and full access to feature properties.
Advanced GIS capabilities
Advanced GIS capabilities
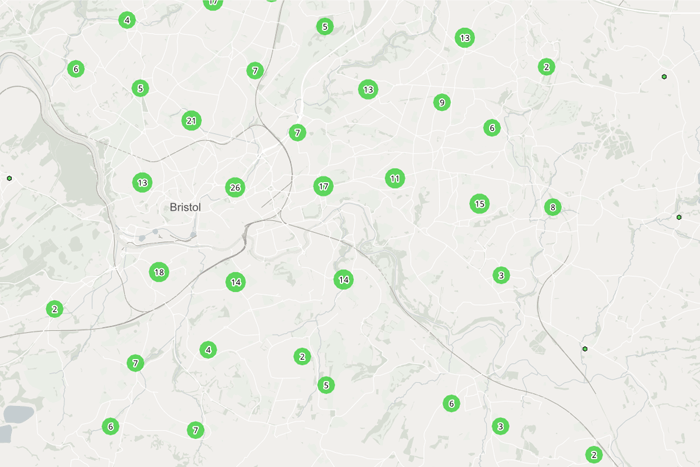
SIS Desktop supports advanced GIS data buffering operations, Thiessen polygon analysis, grid analysis, contour mapping, flowline generation, clustering, and hotspot mapping.
Network topology can be created to manage and run routing analysis. Powerful expressions can be applied to analyse the cost of travel, allowing time and distance maps to be created.
A temporal control bar allows time-series data to be inspected and exported to video.
Productivity tools for automating and customising workflows
Data modelling is performed using expressions to define relationships and to derive additional data from layers of spatial information. These are used to create unified attribution and run dynamic queries, continually calculated against changing data resources.
Users can combine a series of operations on data for processing and analysis. With a range of functional processes, input data can be manipulated in many ways to clean, build, restructure and analyse, creating modified output data.
RELATED PRODUCTS AND SERVICES
Latest Insights